


Greenhouse Evapotranspiration
Quick Summary
- Evapotranspiration (ET) in greenhouses is different from outdoor ET due to climate control in the greenhouse.
- Greenhouse ET can be measured with an atmometer or an evaporation pan and total ET volume can be calculated from a growing bench with a closed canopy.
- By weighing pots to determine how much water they used at different times of the production cycle, growers can develop crop coefficients and utilize their greenhouse ET measurements.
Evaporation and Transpiration
Evaporation is the process by which water turns into vapor from a surface. After an irrigation or precipitation event, water evaporates from the growing media, soil, and wet plant surfaces. Conversely, transpiration refers to water traveling through a plant’s roots and vascular system and turning into vapor inside the leaf mesophyll, before leaving to the atmosphere through stomata. These two processes are driven by the same variables, and since most models treat them together and it’s difficult to measure them separately, the resulting variable is called Evapotranspiration (ET). Thus, evapotranspiration measures how much water is used by a field, a nursery bed, or a greenhouse bench due to the combined effect of evaporation and transpiration.
Evapotranspiration is driven by environmental variables, such as solar net radiation, air humidity, air temperature and wind speed (in order of importance); and at the same time by crop factors such as plant species, spacing, shape, size and physiological status. Contrary to popular belief, the main environmental variable driving evapotranspiration is solar net radiation, not air temperature. These two are often correlated, although close to the coast solar radiation can be high while air temperature is cool. We hate to admit, but your irrigation manager may be wrong when they say: “I irrigated more today because it’s hot” when they should say “because it’s sunny”.
To separate the environmental effects from the crop effects on evapotranspiration, the concept of Reference Evapotranspiration (ETo) was created. This is only an environmental variable, and it has nothing to do with the crop. It can also be defined as the evaporative demand of the atmosphere and was previously called “Potential Evapotranspiration”. It depends only on the weather (or the greenhouse environment) at a specific time and location. For example, in California, the Department of Water Resources maintains a network of outdoor weather stations called California Irrigation Management Information System (CIMIS) that measure the four variables above and calculate Reference Evapotranspiration. This is the evapotranspiration that a turf grass surface with specific characteristics would have in that specific location and environmental conditions. The crop effects are instead expressed with a coefficient that adjusts the reference upwards or downwards depending on the crop. This is called a crop coefficient (more on this later).
We measure evapotranspiration in units of depth, just like we do for rain. If you want to know how many gallons of water a 1-inch storm applied to your field, you need to multiply this depth by the field area. For instance, if the field is one acre, then the volume of rainwater distributed is one acre-inch, or 27,154 gallons. Similarly, if evapotranspiration of your 1-acre crop for the past week was 1 inch, a volume equal to 27,154 gallons evapotranspired from it, and you would have to apply that same volume of irrigation to replenish the water lost by evapotranspiration. This same concept also applies to a bench or a bed with containers in a greenhouse: you need to multiply the depth of evapotranspiration by the area of your bench to calculate the volume of water evapotranspired by that bench. Notice that you may have to split this weekly irrigation requirement into many applications, with more frequent applications and smaller volumes in a sandy soil or in a coarser growing media and less frequent in clay or finer media, but the total weekly requirement should be independent of the soil or media type.
Why is this useful
My mother had an old Suzuki with a broken fuel gage. She didn’t know how much gasoline was in the tank at any time, but she knew that the car could drive 25 miles with a gallon. So, she kept track of the miles she drove and refilled the tank before it reached half full. Using evapotranspiration to manage irrigation employs the same strategy. We don’t need to measure water content in the containers or in the soil, rather, we can measure how much water they lose to the atmosphere. When a certain quantity is gone, we irrigate. We irrigate with the same amount of water (volume or depth) that was lost to the atmosphere since the last irrigation. This method is useful because measuring soil moisture or weighing pots to determine their water content is equipment or labor intensive. We of course still recommend you do that (at least occasionally), but evapotranspiration is useful to get an overall picture of your plants’ water needs and use. It’s a good back-of-the-envelope calculation.

How to measure it
In the greenhouse environment, conditions can vary widely depending on glazing, ventilation, cooling, venting, irrigation frequency, etc. Two greenhouses at the same location can have strikingly different greenhouse evapotranspiration, while two outdoor fields at the same location experience essentially the same environment. Thus, a system like CIMIS is not appropriate for greenhouses, and the best method is to measure evapotranspiration directly in your greenhouse. You can do it accurately using rudimentary tools.
The simplest way is to fill a cooking pot or straight walled bucket with water and measure its level every day with a ruler (Figure 1). For accurate readings, do not let the water level drop more than one inch below the pot rim. If you log your readings every day on a clipboard, you will notice seasonal fluctuations and even the effect of radiation reducing practices such as whitewash application. This method will give you evapotranspiration in units of depth. The daily decrease in water level should be in the order of a tenth of an inch (Figure 2). To convert this depth into the volume of water used by your plants, you will have to multiply it by the surface area of your bench or bed, or in some cases by the area of the containers.


Another way is to weigh the cooking pot every day to determine how much water evaporated from it. This method is more accurate, but you will obtain a weight of water instead of a depth. You will have to convert the water weight into a volume (remember, 1 weight oz = 0.96 fl oz) and then divide it by the top area of the cooking pot to obtain a depth. If you have trouble with these calculations, call us.
The third method is to buy an evaporative gauge also called an atmometer. This is a simple, inexpensive instrument that you refill monthly with distilled water and allows you to read the water level on a graduated sight-gauge (Figure 3). While we never endorse specific brands, here is an example of one we use http://www.etgage.com/. If you are a true nerd (like Gerry) you can buy the model of the atmometer with electronic output and collect the data with a datalogger. Figure 2 shows the evapotranspiration measured with one of these instruments in the greenhouse at the South Coast REC in Irvine (black line). Whichever instrument you decide to use, make sure you place it close to your plants, so it will be exposed to the same environment that they experience. This is important because you will be tempted to install the evaporating instrument out of the way, in a corner, where conditions may be very different than among the plants. Resist this temptation.
Greenhouse Vs Outdoor
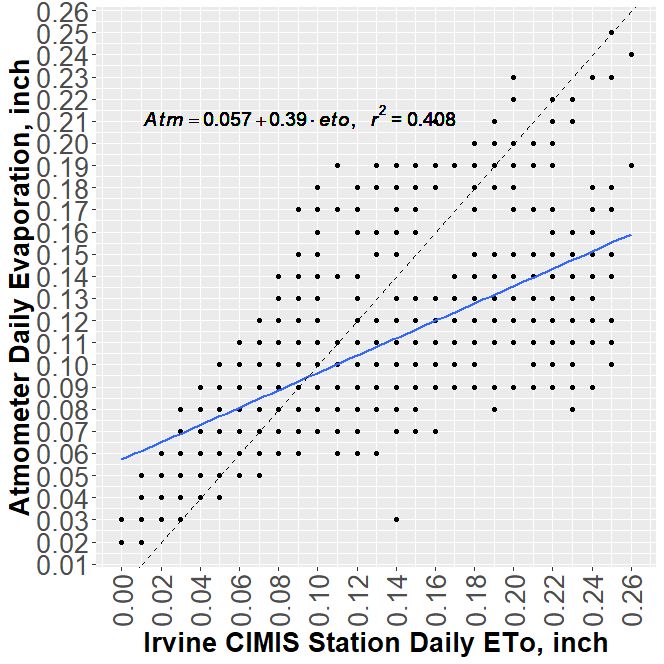
So why not use CIMIS like our outdoor colleagues do? It turns out that greenhouse transpiration is very different and poorly correlated to outdoor evapotranspiration (r2 = 0.4, Figure 4). This is because in greenhouses we strongly alter the four driving variables of evapotranspiration compared to outdoors. In a greenhouse, net radiation is always lower than outdoors: greenhouse glazing has a transmission coefficient that is always lower than 100%. Even glass that has the highest light transmission coefficient, generally achieves around 90%. Poly transmits about 70% of the outdoor light, double poly about 50%. Dust, algal growth, condensation and other factors can reduce these coefficients from their theoretical values even more. Additionally, in southern climates we purposely reduce net radiation with shade screens, whitewash, Aluminet, etc. to reduce heat in the greenhouse during the hot season. It’s common to remove the screens or whitewash at the beginning of fall to allow more light in the greenhouse. As a result, in spring and summer we have a lot less radiation inside the greenhouse than outside, while in winter we only have a little less. Relative humidity is generally higher in a greenhouse than outside, because plants transpiring add water vapor to the enclosed environment and because we often use evaporative cooling that also adds water vapor to the greenhouse. Air temperature is generally higher in a greenhouse, although the areas close to the cooling pads can be cooler than outside. Air temperature is always higher than outside in winter, and we work hard with venting and evaporative cooling to avoid it from becoming too much higher than outside in summer. Wind speed is lower but constant in a greenhouse, due to the widespread use of exhaust fans and horizontal air flow fans.
All these modifications that we purposely make to the greenhouse environment cause greenhouse evapotranspiration to be higher than outside in winter (little less radiation, a lot warmer air) and lower than outside in summer (a lot less radiation, cool and humid air). In other words, if the greenhouse is managed properly, evapotranspiration is quite flat and changes less with the season than outdoor (CIMIS) reference evapotranspiration (Figure 5).

How to use evapotranspiration to calculate irrigation recommendation
Whether you use a cooking pot or an atmometer to measure evaporation in a greenhouse, you will obtain the measurement in units of depth of evaporated water expressed in inches. As a first approximation, you can use this information to calculate the volume of irrigation needed to replenish the water evapotranspired by your plants from the growing bench in the same period. In other words, we are assuming that the plants used the same quantity of water that evaporated from a free water surface. To calculate this volume, you need to multiply the measured evaporation depth by the bench total area. Remember, one inch of depth multiplied by an area of one square foot equals 0.623 gallons, or 79.8 fl ounces. For example, if you measured 0.1 inch of evapotranspiration in the greenhouse per day, a 12 ft by 4 ft bench full of plants used (0.1 inch x 48 ft2 x 0.623=) 3 gallons or 384 fl oz. Now you can look up or measure the flowrate of your drippers or sprinklers to figure out how many minutes you need to run them to apply 3 gallons. On our bench, we have 72 plants, each served by a 0.5 gph drip emitter. So, the whole bench produces (72 x 0.5=) 36 gph or 0.6 gpm. To apply 3 gallons, we run the system (3/0.6)= 5 minutes. On another bench, we have 8 spinning inverted micro-sprinklers that produce 11.7 gph each. So, the whole bench produces (8 x 11.7=) 93.6 gph or 1.56 gpm. To apply 3 gallons, we run the system (3/1.56)= 2 minutes. Since we spaced the containers can-to-can, the interception efficiency is 0.78 and we increase the irrigation time to 2/0.78= 2 minutes and 30 seconds. If these calculations are daunting, please call us. We run these numbers every day.
Figure 2 shows daily greenhouse evapotranspiration measured with an atmometer and daily plant water use measured with load cells for a full cycle of Osteospermum in spring 2026. While the measured evaporation (black line) is relatively stable throughout the cycle, you will notice that the water used by the plants (color lines) is a lot below it at the beginning of the season, and a lot above it starting from half through the cycle. As we said earlier, the measured evaporation is a purely environmental variable, while there is also a plant effect superimposed that depends essentially on how much plant canopy covers the bench area. When the plant is a small plug, it uses less water than our measure of greenhouse evapotranspiration, when it’s ready for sale, about twice as much. So, if you had used the first approximation in the paragraph above, you would have overirrigated when plants are small and underirrigated at the end of the cycle.
Thus, once you have measured greenhouse evaporation, you need to adjust it for your plant species and development stage. In outdoor agriculture we use a coefficient to account for the effect of plants and we call it a crop coefficient (Kc). The crop coefficient tells us how much more or less water the crop used compared to reference evapotranspiration. In a greenhouse, the main variables that determine the crop coefficient are canopy size (e.g. whether the plant is small or large) and container spacing on the bed or bench. Small canopy and wide spacing result in a smaller crop coefficient, since there are less foliage and evaporating surfaces than with a large canopy or tight spacing.
Figure 6 shows the same data in Figure 2 but normalized by evapotranspiration. In other words, we expressed the evapotranspiration of each plant in terms of greenhouse evaporation measured by the atmometer that now is represented by the horizontal black line. The color lines are crop coefficients, i.e. they describe how much more or how much less water the plant used compared to the reference greenhouse evaporation measured with the atmometer. If your container size, spacing, and cycle length are similar to ours (72 1-gal containers on a 12 ft by 4 ft bench, 6 weeks cycle), could you use our crop coefficient to adjust for the evaporation you measure in your greenhouse?

Are crop coefficients transferrable?
This is the $1M question. Can you use the crop coefficient that you developed in a greenhouse at a location to adjust the evaporation measured in a different greenhouse? In theory, yes, because the environmental variability is accounted for by the evaporation that you directly measure in the greenhouse, while the crop coefficient describes the development of the plant’s canopy. However, there is a lot of skepticism against this approach. To try to answer this question, we grew plugs from the same batch of Osteospermum planted on the same date with the same containers, growing media, fertilizer and irrigation schedule in the greenhouse of the Center for Applied Horticultural Research at Altman Plants in Vista. Figure 7 shows the greenhouse evaporation and the plant evapotranspiration (or water use) (equivalent to Figure 2) and Figure 8 shows the crop coefficients we obtained (equivalent to Figure 6). Notice that the Vista greenhouse ran cooler and evaporation and water use were lower than in Irvine throughout the cycle. However, when we normalize for greenhouse evaporation, the crop coefficients obtained are very similar between greenhouses. Also notice that the lower temperatures in the Vista greenhouse made the plant cycle longer and plants were ready for sale about 10 days later than in Irvine. You could also normalize the crop coefficient development shape for the length of the cycle. This is routinely done for outdoor vegetables such as lettuce.


The data shown is for Osteospermum, but we have found very similar pattern for fully irrigated bench-grown, trade 1-gal containers for Vinca (Catharanthus), Impatiens, Pentas and Marigold (Tagetes). Our crop coefficients are a good place to start, but our recommendation is to develop your own crop coefficient by weighing your pots on a scale. This is labor intensive, but you will learn a lot by weighing five pots per bench two days in a row at the beginning, in the middle and at the end of the cycle. You may learn that the crop coefficient is 0.5 during the first two weeks, 1 in weeks three and four, and about 2 in the last three weeks of the cycle. Such an ET-based irrigation scheduling method may be also reported as a water management optimization practice for water quality regulations compliance.